Here is a recap of market performance for October and year-to-date:

Financial markets had mixed results in October. Stocks rallied, with US small cap stocks leading the way. US large cap and international stocks also increased. Bonds, however, lagged, and declined for the month. For the year, all four asset classes remain negative.
A Market of Stocks, Not a Stock Market
Most of the time, investors interact with the market as a whole. We turn on the news and see how the S&P 500 or Dow Jones Industrial Average performed on a given day. These indexes represent a large collection of stocks – it’s a way to get a big-picture look at financial markets.
What’s important to remember is that these broad indexes consist of many individual stocks. Company or sector specific dynamics often differ widely. For example: last week, Meta Platforms (META, formerly Facebook) reported disappointing earnings and the company’s stock fell over 20%. On the same day, the S&P 500 was basically flat. META represents about 1% of the S&P 500, so it had some impact on the index, but not much.
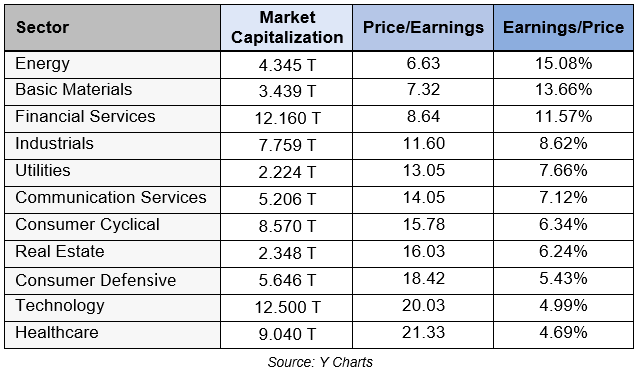
The chart below shows the 11 sectors that comprise the S&P 500, as well as the following data points:
- Market Capitalization – the total dollar value of the stocks in that sector
- Price/Earnings ratio – the prices of the stocks in the sector divided by profits the companies make
- Earnings/Price – also known as earnings yield, the inverse of the P/E ratio

The table shows that not all sectors are the same. Some, like Technology, are worth more than others, such as Basic Materials or Utilities. Also, there can be noticeable differences in the P/E ratios or earnings yields.
Should this be the case? If the P/E ratio goes lower, investors should be more willing to buy those stocks, because they are cheaper relative to earnings. After all, buyers want to pay a low (or at least reasonable) price for an investment. Similarly, a high earnings yield indicates the potential for higher future returns. Isn’t this attractive?
While these data points may be good places to start for evaluating investments, there could be valid reasons why these numbers differ. Currently, investors are willing to pay higher prices for the Consumer Defensive, Healthcare, and Technology sectors than they are for Energy, Basic Materials, or Financial Services. Why? A few reasons may include:
- Earnings Growth – The P/E ratio looks back at the last 12 months of earnings, but investors arguably care more about what future earnings will be. Higher P/E ratios typically indicate higher revenue and earnings growth rates. In other words, investors expect higher future earnings.
- Predictability – While prices and earnings are always in flux, some companies are more predictable than others. Investors may favor consumer defensive stocks during periods of economic uncertainty or concern about recession because people tend to buy food, beverages, and household goods regardless of economic conditions.
- Emotions – People like to associate with people –or companies– they consider “winners.” Companies with popular products like Apple, Microsoft, or Tesla tend to attract investors. Warren Buffett is perhaps the greatest investor of all time, so people want to be a part of his company. (Tens of thousands of people travel to Omaha, Nebraska every year to attend the Berkshire Hathaway annual meeting!)
- Other Motivation – Some investors approach the market through another lens. They may not care at all about the economic dynamics, instead looking at shorter-term price trends, movements, or other indicators.
Investors often take a one-size-fits-all approach, as if every stock is the same. But there are thousands of publicly traded companies globally. And while many of them have overlapping business dynamics, they also have specific factors, unique to them, that influence their results. Certain companies may benefit from one type of environment while others don’t. Additionally, relative to their earnings, some stocks cost more to buy than others.
As your investment advisors, our job is to analyze the market of stocks and create a portfolio with a high probability of making attractive returns over time. There can be large differences in how stocks are priced, so these decisions lay the groundwork for how portfolios will perform in the future.
If you would like to talk more about how we use this type of information to allocate the holdings in your account, please let us know.
