
Market Recap
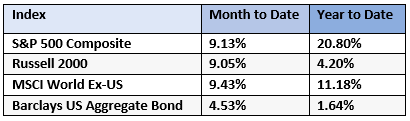
In November, financial markets surged higher. International stocks increased the most, followed by US large and small cap stocks. Bonds also made positive returns. For the calendar year, US large cap stocks have performed best, followed by international stocks. Small cap stocks and bonds made smaller but still positive returns.
How Is The Market Doing?
Perhaps the most common question we hear – whether from clients or relatives around a holiday dinner table – is, “How is the market doing?” Especially this year, the answer depends on what you mean by “the market.”
Approximately 2,300 securities trade on the New York Stock Exchange. Financial research company S&P Global uses a list of criteria to narrow these down to create the S&P 500 Index (SPY). Because this index is often quoted by the media, we find that investors tend to think its performance reflects the overall performance of “the market.” Is the S&P 500 a good indicator? Let’s discuss.
Here are some of the criteria a company must meet in order to be considered for the S&P 500:
- Market capitalization (the total value of the stock) must be $14.5 billion or greater
- Adequate liquidity – ample shares available for public trading so that investors can buy/sell efficiently
- Profitability – companies considered for inclusion should have positive earnings over the four most recent quarters (stocks already in the index will not be automatically removed if they lose money)
Many criteria affect the composition of the S&P 500 index, but the most significant is Market Capitalization. Most stocks are much smaller than the $14.5 billion minimum, so only the largest stocks can be added. Furthermore, SPY is also weighted by market capitalization. The biggest stocks have the highest weightings and therefore the largest impact on the index’s performance. For example, the top four stocks are Microsoft, Apple, Amazon, and Nvidia. Microsoft and Apple combined make up nearly 15% of SPY. If you add Amazon and Nvidia, they make up over 21% of the index.
Alternatively, investment management company Invesco created an ETF that uses the same stocks as the S&P 500, but weights them equally. The four stocks mentioned above comprise less than 1% of the index. The following table shows rates of return for both of these funds over various time frames:
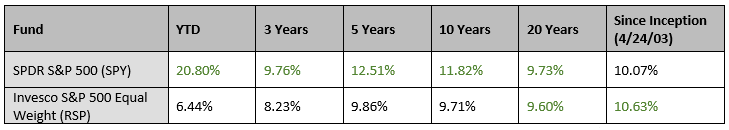
This year, the S&P 500 has outperformed its equally-weighted counterpart by over 14 percentage points – a significant difference. This recent dominance has tilted the 3/5/10 year returns in its favor as well. Over a 20-year period, the difference is negligible. But since its inception, RSP has actually outperformed SPY. This year, there is a large divergence between the two funds, but over the long run, they have performed mostly in line with each other.
So what does this have to do with your investments? Here are a couple of points to ponder:
- While we have come across many different types of investment strategies over the years, we have yet to find one that consistently wins all the time. We consider the pros and cons of any methodology (cap weighted vs. equal weighted, in this case), rather than simply labeling them “good” or “bad.”
- As a group, investors tend to chase the performance of investments or strategies that have done well recently. While this is very normal behavior, in the long run it usually leads to lower returns (as you may remember from our August market recap!) Next year is usually different than last year.
If you want to talk more about how current market dynamics affect your investments, let us know.